1 Minute Scalping Indicator for TradingView: Tested on MNQ
A 1 minute scalping indicator for TradingView only earns its place if it survives a full year of data. This one did: 365 days on the 1 minute MNQ chart, a 1.94 profit factor and a 2.38% max drawdown. Below are the rules, the settings, the free alternatives and why most 1 minute indicators fail.
Best TradingView indicator for scalping on the 1 minute chart
On a 1 minute chart, lagging indicators like MACD or stochastics fire after the move is over. The best TradingView indicator for scalping gives you two things fast: a reference level that tells you which side to trade, and a trigger that confirms the move is real.
That is exactly what the NAS100 Continuation + Reversion indicator does. It plots one line, the pre-open fair value price, and only signals when a displacement candle lines up with a break of structure. Everything outside the two session windows is ignored, which removes most of the chop that kills 1 minute scalpers.
How the 1 minute scalping strategy works
The indicator is built on the JJ Simons fair value theory for NQ. The pre-open price becomes fair value, and that one line creates two trades.
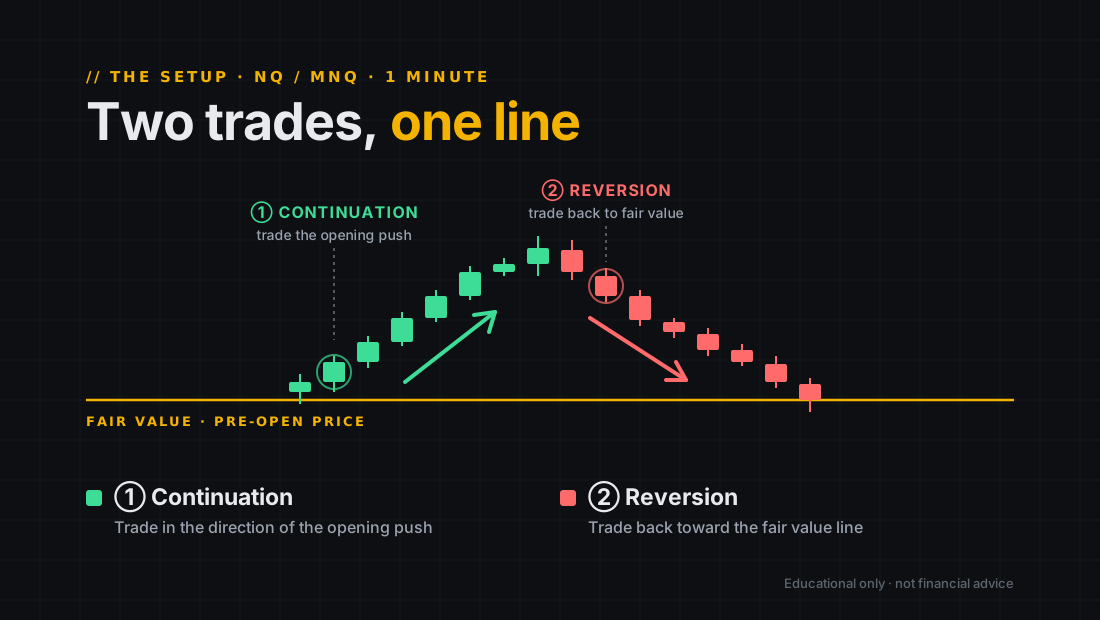
- Mark fair value. Before 9:30 a.m. New York time, the pre-open price becomes the fair value line. The indicator plots it for you.
- Skip the first three minutes. The open is the noisiest part of the day.
- Continuation. In the first 10 to 15 minutes, trade the opening push away from fair value once a displacement candle and a break of structure (BOS) line up.
- Reversion. When the push runs out of momentum, wait for a market structure break (MSB) plus displacement, then trade back toward fair value.
- Exit at 1.5R. No trailing, no partials, no management.
The same logic runs in a second window from 2:00 to 3:00 p.m. New York time, using the 2:00 p.m. price as fair value.
NAS100 Continuation + Reversion
1.94 profit factor · 56.7% win rate · 2.38% max drawdown · full editable Pine Script source · one-off price, no subscription
Get the indicator: $971 minute scalping indicator settings
A fixed stop on a 1 minute chart is either too tight on a fast open or too wide on a slow one. The indicator scales the stop with ATR, so the dollar risk stays flat while the point distance changes.
| ATR regime | Stop (NQ pts) | Target (1.5R) | NQ contracts |
|---|---|---|---|
| Above 20 · high volatility | 50 | 75 | 1 |
| 7 to 20 · normal | 25 | 37.5 | 2 |
| Below 7 · low volatility | 16.5 | 24.75 | 3 |
One NQ point is $20, so each tier risks roughly $1,000 per trade. MNQ is one tenth of NQ, so the same tiers risk about $100 per trade on MNQ, which is where most prop firm and smaller accounts should start.
Free 1 minute scalping indicators on TradingView
If you want to test the idea before paying for anything, these free indicators cover the basics:
- VWAP: your session bias. Longs above, shorts below.
- 9 and 21 EMA: pullback entries in the direction of VWAP.
- ATR (14): size your stop from current volatility instead of guessing.
- Session high and low: TradingView's built-in session tools mark the overnight range, a common 1 minute target.
The catch: free indicators give you the pieces, not the rules. You still have to define the session window, the entry trigger and the exit, then backtest it yourself.
Why most 1 minute scalping indicators fail
- They repaint. The signal looks perfect in hindsight because it moved after the candle closed. If there is no strategy version you can run in the Strategy Tester, assume it repaints.
- They ignore costs. On a 1 minute chart, commission and slippage can eat the whole edge. Always set them in the backtest settings.
- They trade all day. Most of the 1 minute session is noise. A tight time window is half the edge.
- They sell a win rate. Searches for a "96.8% win rate" scalping indicator are common. A win rate that high almost always means a tiny target and a huge stop, or a cherry-picked test period. Ask for profit factor and drawdown over at least a year.
1 minute scalping strategy PDF
The fair value method this indicator is built on is explained step by step in the JJ Simon strategy guide, including the diagram, the entry model, the risk tiers and the full 365 day backtest breakdown, with a free PDF version to download.
What about a 5 minute scalping indicator?
A 5 minute scalping indicator on TradingView trades less often and suffers less from noise and costs, but you give up precision on the entry. The fair value line still matters on the 5 minute chart as a bias level. The tested version of this indicator runs on the 1 minute chart, and that is where the published numbers come from.
1 minute scalping: what Reddit says
Read enough Reddit threads on 1 minute scalping and the same warnings keep coming up: most people lose money scalping the 1 minute chart, overtrading is the main killer, and costs matter more than the indicator. The traders who make it work usually trade one market, one session and one setup. That is the whole design of this indicator: NQ only, two short windows, one fair value line.
1 Minute Scalping Risk Calculator
Size any futures scalp before you take it. Pick the contract, enter your account and risk, and the calculator gives you the number of contracts, the dollar risk and target, and the win rate you need to break even once commission and slippage are counted. Switch the stop mode to ATR tier to use the same volatility stops as the strategy above.
Futures point values used in the calculator
| Contract | Per point | Tick size | Per tick |
|---|---|---|---|
| NQ | $20 | 0.25 | $5.00 |
| MNQ | $2 | 0.25 | $0.50 |
| ES | $50 | 0.25 | $12.50 |
| MES | $5 | 0.25 | $1.25 |
| YM | $5 | 1 | $5.00 |
| MYM | $0.50 | 1 | $0.50 |
| GC | $100 | 0.10 | $10.00 |
| MGC | $10 | 0.10 | $1.00 |
FAQ
What is the best 1 minute scalping indicator for TradingView?
VWAP with a 9 EMA is the best free 1 minute scalping setup. For a tested rule-based system, the NAS100 Continuation + Reversion pack returned a 1.94 profit factor, 56.7% win rate and 2.38% max drawdown over 365 days on the 1 minute NQ/MNQ chart. It is made by the publisher of this site.
Does 1 minute scalping actually work?
It can, but only with strict session filters and realistic costs. Most 1 minute strategies fail because they trade all day, ignore commission and slippage, or use indicators that repaint.
What are the best settings for a 1 minute scalping indicator?
Scale the stop with ATR rather than using a fixed size. On NQ the tested tiers are a 50 point stop above ATR 20, 25 points between ATR 7 and 20, and 16.5 points below ATR 7, each with a 1.5R target.
Is a 96% win rate scalping indicator real?
Treat it as a red flag. Very high win rates usually come from tiny targets and wide stops, repainting signals, or cherry-picked periods. Ask for profit factor and max drawdown over at least a year.
Is there a free 1 minute scalping strategy PDF?
Yes. The full JJ Simons NQ fair value strategy, which this indicator is built on, is available as a free PDF.
How many MNQ contracts should I trade?
Divide the dollars you are willing to lose on one trade by the loss per contract at your stop, including commission and slippage. MNQ is worth $2 per point, so a 25 point stop costs $50 plus costs per contract. With $250 of risk that is 4 contracts. The calculator above does this for you.
What is a break-even win rate?
The percentage of trades you must win to make zero after costs. It equals net loss divided by net win plus net loss. At 1.5R with no costs it is 40%, but commission and slippage push it higher, especially on micro contracts with small stops.
NAS100 Continuation + Reversion
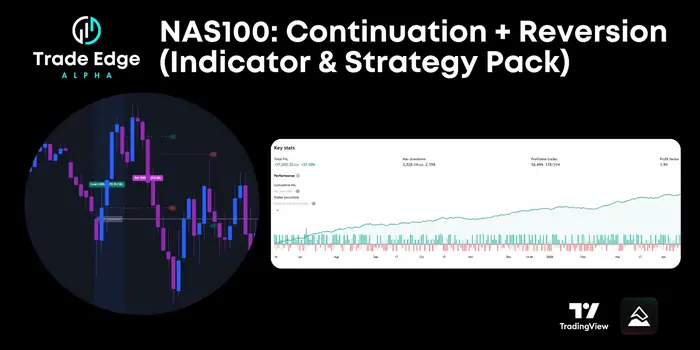
Indicator + automated strategy · full editable Pine Script source · works on free TradingView
Hypothetical results from historical data, not a forecast.